Figure 1 (click to view initial window capture)
| Recently I've been working on a new, more scientific, BPM algorithm. Hopefully, there should be something to see in a month or so. |
In order to get a song to play properly with Final Scratch you need to 'stripe' it. This process creates a 20-samples a second version of a song. Each sample is an unsigned 8-bit value representing the mean amplitude of the song during that 20th of a second slice.
The BPM measurement in the editor uses this stripe data, this has many effects:
If you look at the lower window in the stripe viewer you will see small red bars in the stripes:

Figure 1 (click to view initial window capture)
These red bars represent detected beats. When a line is drawn, the level at that point becomes the compare level. The compare level then decays exponentially until the stripes level peaks above it. this is repeated over the level of the song.
This part of the algorithm does not have to be perfect (and as you can see it isn't). Some of the double bars seen above are caused by the smearing mentioned in step one.
To measure the BPM we need to consider the distance between the events in figure 1. This will be easier to describe if I reference a picture

Figure 2 (click to view initial window
capture)
After working out the beats, the app scans through each beat. At each beat it checks on the location of previous beats. The difference in location between the current beat and any previous beat is stored. Figure 2 above can be seen as a graph of count (y-axis) against inter beat distance (x-axis).
A short example: Lets say we have beats on the 3rd, 16th, 28th and 40th stripe. Processing would run roughly:
| beat on stripe |
distance counts (diff in brackets) |
||||||||
| 1-11 |
12 |
13 |
14-23 |
24 |
25 |
26-36 |
37 |
... | |
| 3 |
all 0 |
0 |
0 |
all 0 |
0 |
0 |
all 0 |
0 |
|
| 16 |
all 0 |
0 |
1 (16-3) |
all 0 |
0 |
0 |
all 0 |
0 |
|
| 28 |
all 0 |
1(28-16) |
1 |
all 0 |
0 |
1(28-3) |
all 0 |
0 |
|
| 40 |
all 0 |
2(40-28) |
1 |
all 0 |
1(40-16) |
1 |
all 0 |
1(40-3) |
|
... |
|||||||||
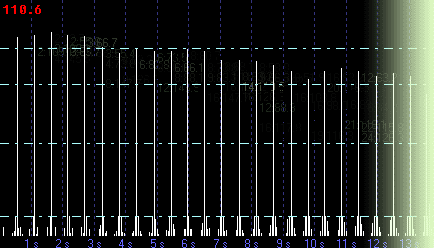
| At the end of the process this total line is used to draw graphs like Figure 1 | |||||||||
The graph above shows the final result (there is a post processing step discussed below). One second (1s on the scale) equals 20 stripes.
At this point you can see the regular peaks. The first peak is built by beats 1 beat apart, the second by beats 2 beats apart etc. etc.
If we know the number of beats a peak's position in time represents, we could divide the time by the number of beats to get the BPM. This is what the numbers in the BPM debug view represent. I removed them from the above view, so I'll give another example.

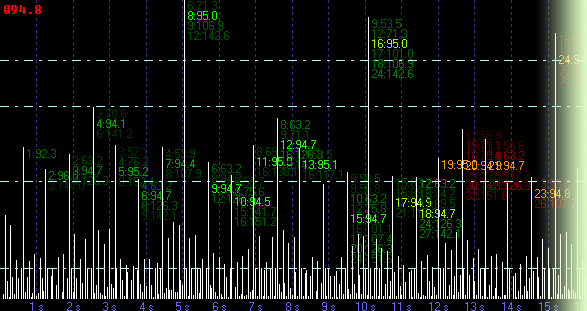
Figure 3 (click to view initial window capture)
Taking the peak labeled 8:95.0 in bright green as an example: The label means that if this peak represents 8 beats, the BPM is 95.0. Just below it there's a very faint 9:106.9. This means that if this same peak represented 9 beats the BPM would be 106.9.
Tracing from left to right from the 8:95 peak we can see a peaks labeled 9:94.7, 10:94.5, 11:95.0, 12:94.7 etc. etc. I'll explain these variations later, but you can see that all these peaks are hinting at a BPM of around 95 BPM.
Figure 2 was generated from the song Good Times by Chic1. Its strong beat produced the regular pattern shown. Figure 3 is from Sexual Healing By Marvin Gaye. As you can see, events one beat apart are still marked, but the events 8 and 16 (and to a lesser extent 4 and 12) beats apart are more evident. This is because events picked up during the beat detection phase are repeated not 1 beat later, but 2 bars (8 beats) later. This bar based pickup happens a lot when analyzing DnB and breaks.
By functioning as a bars-per-minute detector rather than a beats-per-minute detector, the algorithm can deal with many kinds of music that are normally problematic (indie, rock, classical etc.).
I glossed over a step earlier, but to introduce it at that point would have introduced confusion. It also allows me to separate the fudge-free (everything up to this point) and the fudge-full (everything from here on in) parts of the process. Onward:
If the BPM is such that the gap between beats divides unevenly into 20th of a second chunks we can end up with a situation where a strong peak is diluted because it's spread over two adjacent bins2.
This is an issue in more rhythmic tunes. With more complex source material wider smearing occurs anyway, so this post-process in not needed.
The current algorithm used to deal with this is very simple. If a peak is found and it has an adjacent bar that's above the mean (the average), the following transform is done:
taller_bar_heightnew = taller_bar_heightold + (shorter_bar_heightold - mean)
shorter_bar_heightnew = mean.
Again, this is somewhere where there's probably some really cool maths to work out what's a significant peak.
In about 98% cases anything that's above half the maximum values is marked as a peak. This works and its really simple, so I prefer it to dead hard sums.
If the average value of all bins is > half the maximum value, every peak above the midpoint of the average and the maximum is taken as a peak. This happens rarely. One song I remember is the theme from 633 Squadron.
Now we're in an odd place. Visually, we can see quite easily what the BPM is, we just have to get the computer to realize what it is. We start by ignoring the first few results (beats adjacent to each other or 1 stripe apart), as there will always be a few beats next to each other.
We have to work out what BPM a peak really indicates. As an example consider a peak representing a difference of 13.
This is how we get the 92.3 label on the leftmost peak in figure 3.
As the two events contributing to a difference could have occurred at any point in their 20th of a second the actual BPM could vary. The amount of variation could also be affected by the double bar correction mentioned above. There's probably a proper way to work this out, but here I create a range by considering points 0.8 x 20th of a second back and forward. Here this gives us the range 86.96 - 98.3 BPM3. This is extremely imprecise.Precision is increased as we move forward and increase the number of beats we're considering. I'll explain. Let's go back to the 8:95.0 peak. This peak is the 101st peak. So we have 8 beats in 101 bars.
This does not appear to be better until we consider the range given by considering points backwards or forwards 0.8 bars. (=0.04 s). Calculating the range again gives 94.30-95.81 BPM4. This makes us happier than the 10+ BPM range we got from the earlier peak.
At this stage, internally, possible BPM's are restricted to the range 50-160 BPM. This range was arrived at after experimentation. It doesn't reflect a range of final possible BPM's, its just used internally.
As we scan left to right, all beat multiples are checked and for any within 50-160 we calculate the possible BPM range.
Only some of the range centers are displayed graphically, but you can see the number of beats:center BPM pairs next to peaks in the above charts.
As we scan across, BPM's that fall within an existing BPM bin's range replace and refine that bin. Results that do not fall within an existing bin create new bins.
Just to recap, we have a large number of candidate BPM bins. We now have to choose one to give as our answer.
Initially I tried a system where each bin had a counter, incremented once when it was refined. A kind of voting system.
This created issues as more and more time was considered, values that were 2/3 or 1½ or other multiples of the true BPM value were receiving many votes. To redress this two things were done.
This is very fudgy. I have a feeling a more selective way of choosing which peaks to consider may provide as good or better results without the fudges.
The brightness of the BPM's in the debug view indicates how many votes the bin has received.
You will notice that the color of the BPM numbers changes from green to red. The voting stops at the end of the green zone, but we continue on because the bins will still get refined. The points at which bin voting and refinement stop were arrived at by experimentation.
As we may have detected multiple beats, or our bar sense may be off, the user is allowed to enter a lower BPM limit. The BPM is halved/doubled until it lies within the range [ limit, 2 x limit ] .
The BPM is then rounded and formatted according to user preferences.
The inner workings of the algorithm are still being tweaked. Please get in touch with Pete if you have tunes the algorithm gets wrong when you can see from the BPM debugging view that it should get them right.
I've started a list here.
Songs that change BPM create issues as the lack of a strong push for one BPM can cause a 3rd 'phantom BPM' to be registered. A song that you may have available that exhibits this behavior is Ladies Night by Kool and the Gang.